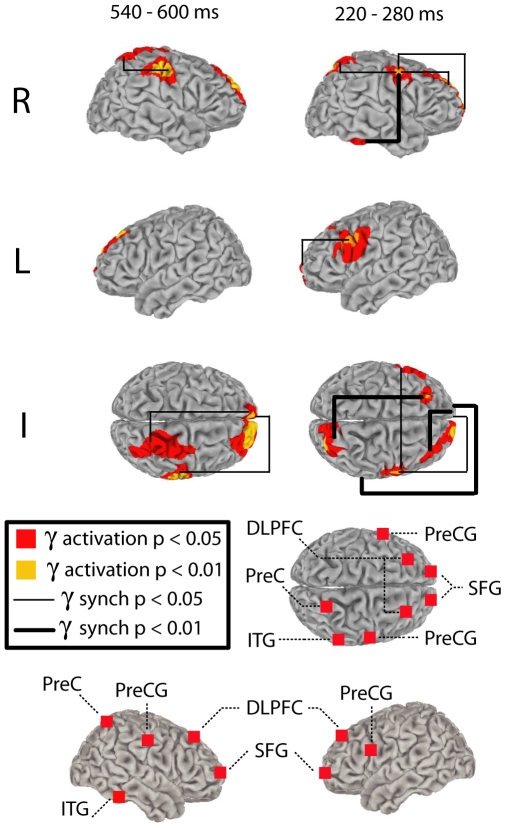
Figure 4. Surface projected regional gamma-band activations, and inter-regional gamma-band synchronization in the 540–600 ms and 220–280 ms pre-response intervals.
For clarity, separate images are provided for (R) right intrahemispheric, (L) left intrahemispheric and (I) interhemispheric synchronization across cortical regions. Lower brain figures show surface projected anatomical loci for all identified gamma-band activations.

