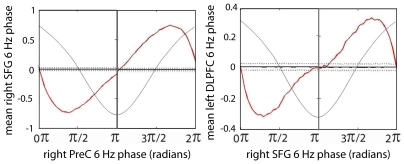
Figure 8. Two examples of theta-theta phase relationship.
Dotted lines represent the 97.5 (top) and 2.5th (bottom) percentiles and the dark black line indicates the mean of the surrogate distribution for each of the 60 bins of the theta cycle. Jagged red line denotes the mean theta phase of the source indicated on the y-axis in each bin of the theta source indicated on the x-axis. When the mean phase was greater than or less than the surrogate line for two or more successive bins we considered the departure to be significant (p<0.05, two-tailed). Radians on the x-axis are in reference to a cosine wave, which is maximal at 0 radians; one cycle of a 6 Hz cosine wave (thin black line) is superimposed on the graph.

