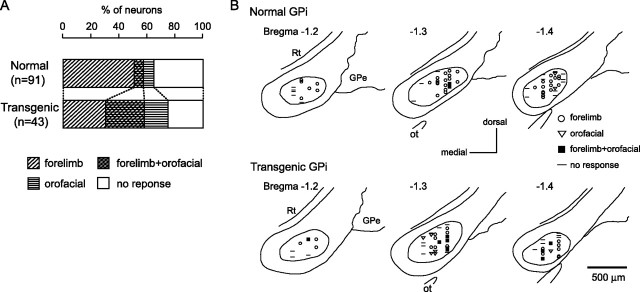
Figure 5.
Somatotopic organization in the GPi. A, Proportions of neurons classified based on cortical inputs in the normal (top) and transgenic (bottom) mice. B, Distribution of recorded GPi neurons indicated by symbols based on cortical inputs. Data from two normal (top) and two transgenic (bottom) mice are shown in frontal sections. The figures in the left top corner represent distance from bregma. Rt, Reticular thalamic nucleus; Ot, optic tract.

