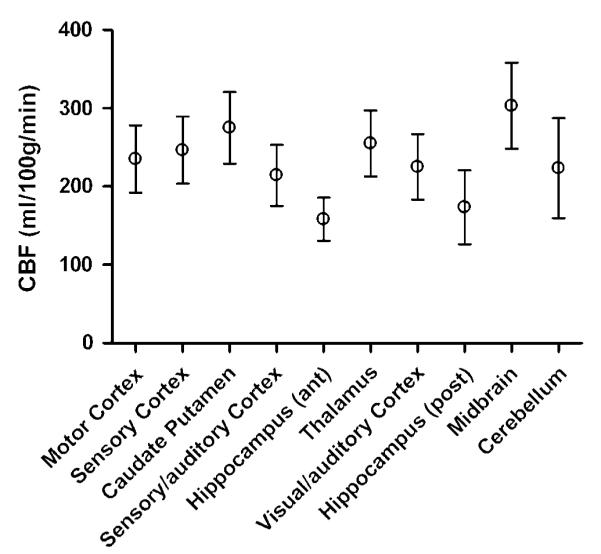
Figure 3.

Regional variation of CBF in the normal rat brain measured with CASL (plotted as means with 95% confidence intervals). Lowest CBF values are observed in the hippocampus and highest CBF values are observed in the deep gray matter regions, that is, midbrain and caudate putamen. Mean CBF values (in mL/100 g min) for each ROI were: motor cortex 235; sensory cortex 247; caudate putamen 275; sensory/auditory cortex 214; anterior hippocampus 158; thalamus 255; visual/auditory cortex 225; posterior hippocampus 173; midbrain 303; cerebellum 223.
