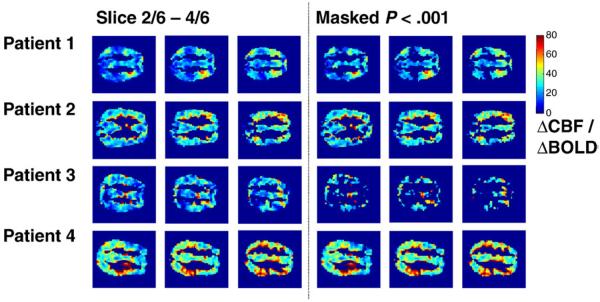
Fig. 1.
A comparison of the percentage change in CBF to the percentage change in BOLD signal for 4 patients (each row). The ratio of ΔCBF/ΔBOLD (i.e., the slope of the linear fit between the two signal changes) is shown for each voxel on the left hand side. On the right hand side voxels are thresholded at a level of P<.001 (uncorrected) the average time signal from these voxels was obtained and tested (see Table 1).

