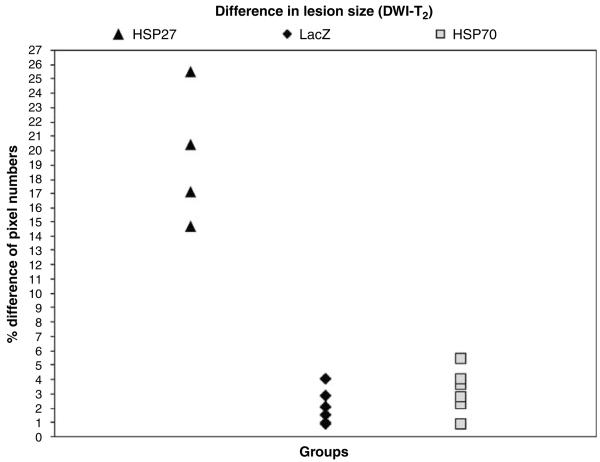
Figure 3.
Percentage difference in lesion size at 24 h after stroke calculated from single-slice DWI and T2-weighted images. The mismatch between the lesion area calculated from ADC maps and the lesion defined on T2-weighted images is larger in HSP27-treated animals than in HSP70-treated or control animals.

