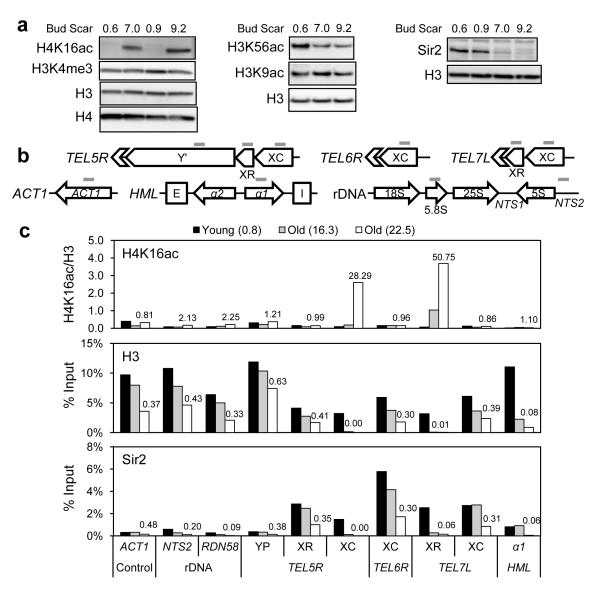
Figure 1. Chromatin and Sir2 levels change in old cells.
(a) Western analysis for extracts from young and old yeast (strain W1588-4C) with specific antibodies. Consistent results were also observed with strain BY4741 (data not shown). (b) Positions of qPCR primers used in ChIP. (c) ChIP analysis for young and old cells (average bud scar counts in parentheses). Chromatin immunoprecipitated with antibodies against H4K16ac (upper), H3 (middle), or Sir2 (lower) was analyzed by qPCR with primers shown in (b). Fold changes for the oldest sample (white bars) over the young cells (black bars) are indicated above the bars.

