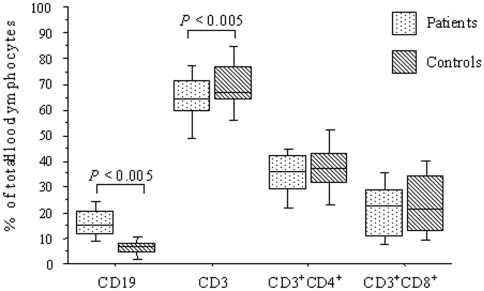
Figure 1. Distribution of B cells (CD19+), T cells (CD3+), and T-cell subpopulations (CD3+CD4+ or CD3+CD8+) in the blood of 33 HAT patients and 27 controls (surveys 1 and 2 combined).
For each box plot, the features limits correspond, from bottom to top, to the 90th, 75th, 50th (median), 25th and 10th percentiles.

