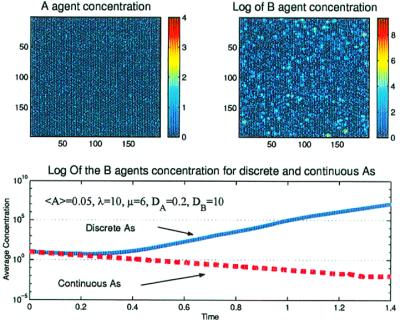
Figure 1.
(Lower) Shown is the exponential growth of the average B population as a function of time, in the actual simulation (solid blue line) compared with the exponential decrease predicted by the continuum approximation (dashed red line). <A> is the average number of A reactants per site. Other symbols are defined in the text. (Upper) The snapshots show the spatial configuration of A and B reactants. B reactants are seen to be localized in islands (notice that what is plotted is the logarithm of B concentrations, thus localization is stronger than first would appear).

