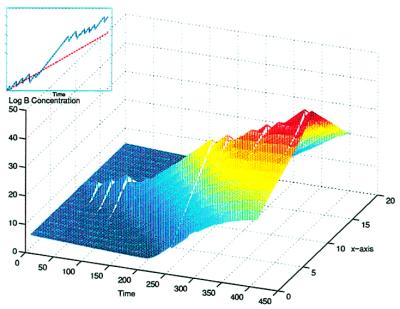
Figure 2.
The profile of a B island as a function of time as it follows the random motion of an A agent. The cross-section of the island is taken through the current location of the A agent. (Inset) The time evolution of the height of the B concentration at the point at which A currently is located (solid blue line). The B colony is seen to grow, although the average growth rate over the entire space is negative (nA is extremely low because there is only one in the whole simulation space, thus λnA − μ ≈ −μ). The dashed red line shows the exponential growth with coefficient ɛ0 − 2dDAκ, where κ = Loge(λ/DB) is the slope of the island (this slope is exhibited in the main graph and can be derived from a simple approximate calculation). ɛ0 is λ − μ − 2dDB derived similarly.

