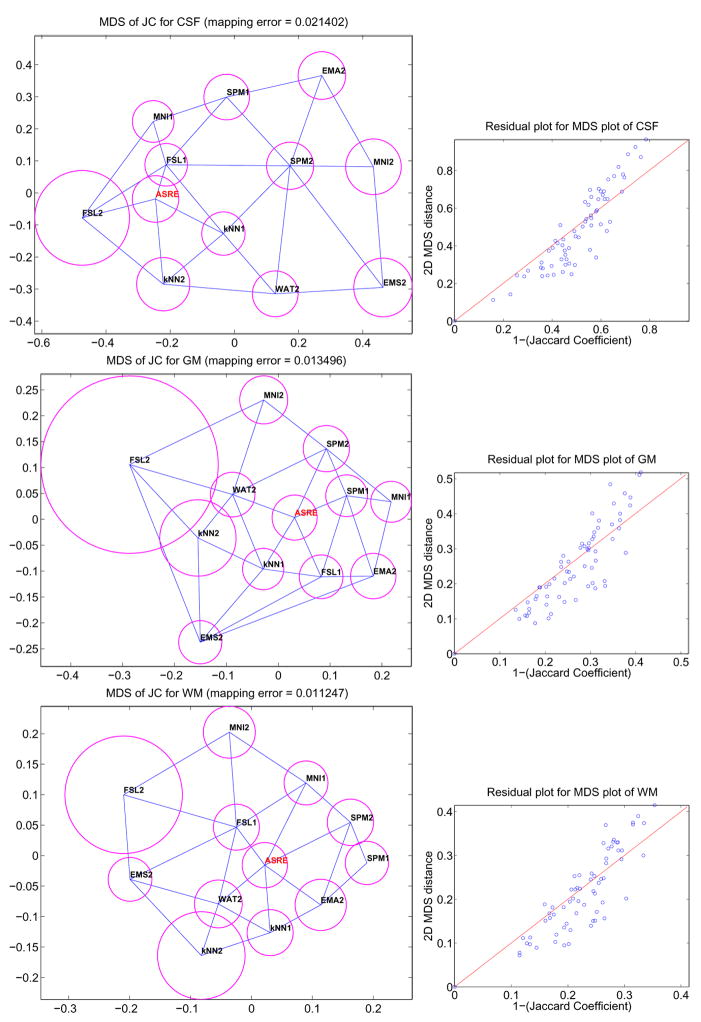
Fig. 6.
MDS plots (left) of the JC matrices for CSF, GM and WM. The value (1-JC) between two methods is represented as the euclidean distance between their corresponding points in the 2D map. The blue lines connect closest neighbors and the magenta circles represent the variability of JC for each algorithm. Residual plots (right) are provided to assess the quality of the mapping.

