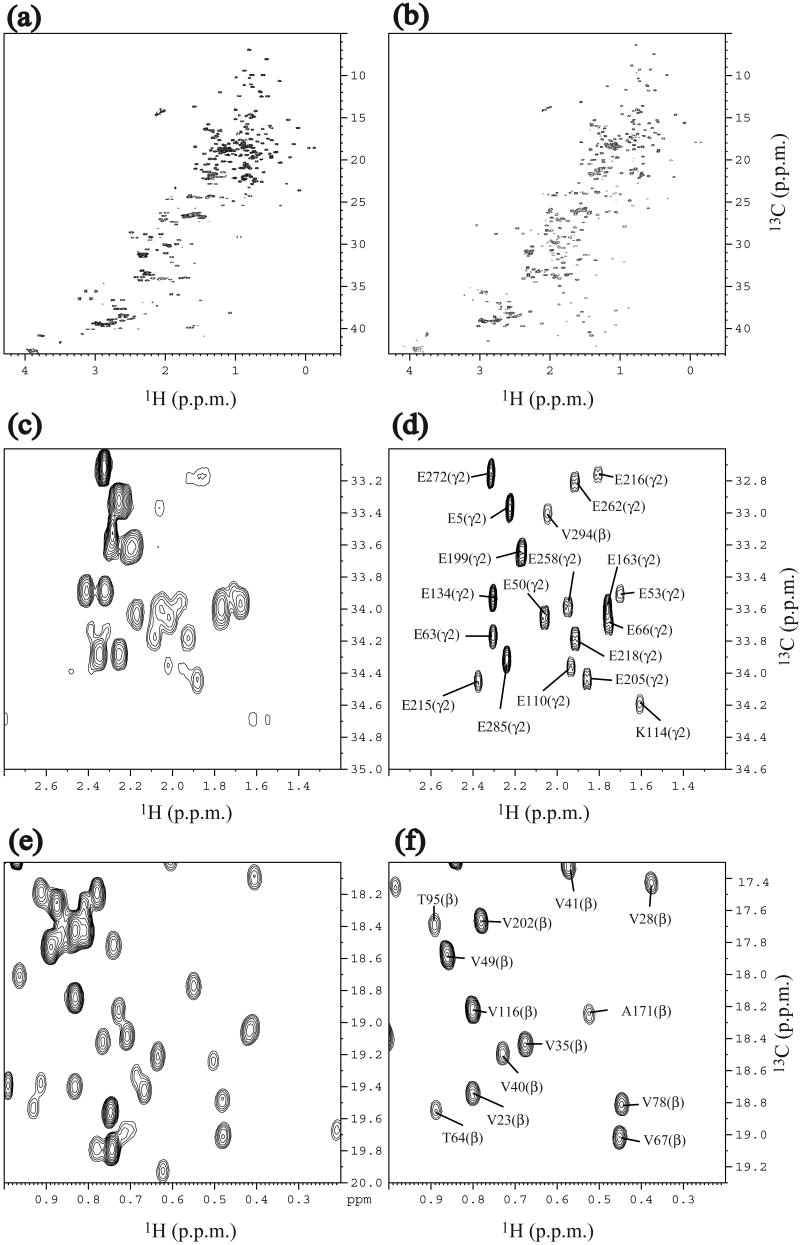
Fig. 1.
Comparison of 1H-13C constant-time HSQC NMR spectra of 0.6 mM of UL-At3g16450.1 and 0.2 mM of SAIL-At3g16450.1. (a) Full spectrum of UL-At3g16450.1. (b) Full spectrum of SAIL-At3g16450.1. (c) Methylene region of UL-At3g16450.1. (d) Methylene region of SAIL-At3g16450.1. (e) Methyl region of UL-At3g16450.1. (f) Methyl region of SAIL-At3g16450.1. Spectra were recorded at 27.5 °C at 1H frequency of 800 MHz. In the case of the SAIL-protein, 2H decoupling was applied during the 13C chemical shift evolution.

