Fig. 5.

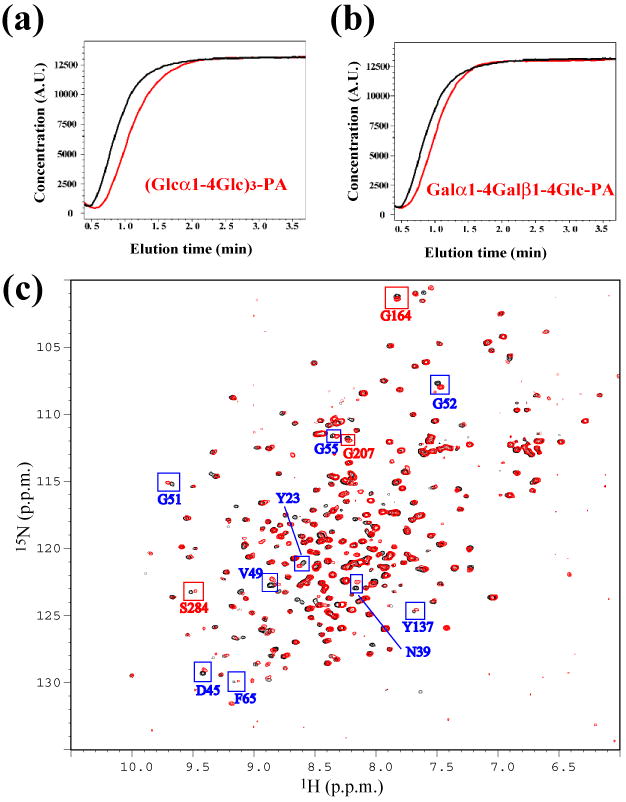
Investigation of sugar binding properties of At3g16450.1. (a) Elution profile of the FAC binding assay for (Glcα1-4Glc)3-PA (red) and control sugar (black). (b) FAC binding assay for Galα1-4Galβ1-4Glc-PA (red) and control PA-sugar (black). (c) Overlay of the 1H-15N HSQC spectra of uniformly 15N labeled At3g16450.1 in the absence (black) and presence (red) of (Glcα1-4Glc)3-PA. Assignments and boxes (blue for N-terminal domain; red for C-terminal domain) label some of the perturbed resonances.
