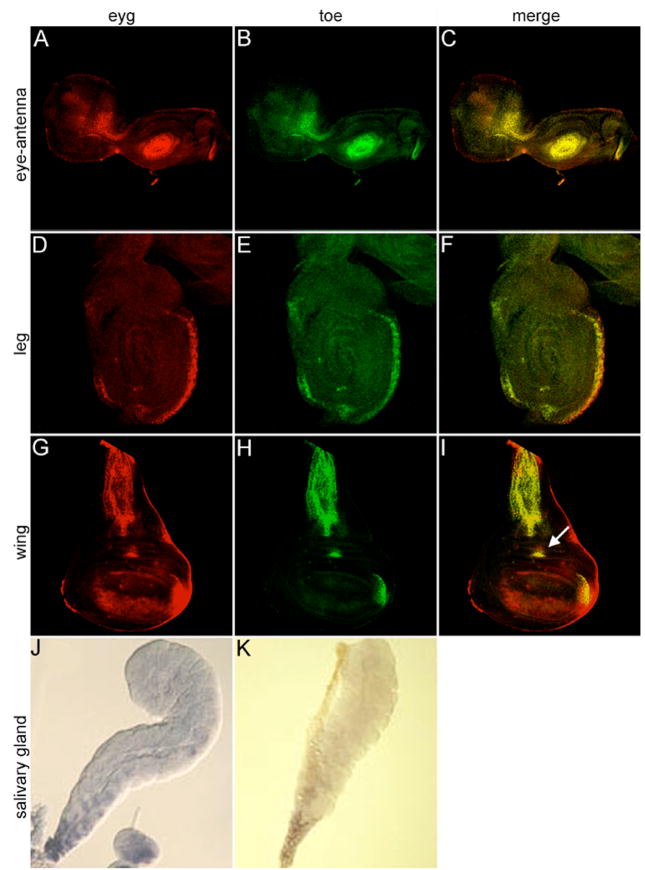
Figure 2. eyg and toe are expressed in nearly identical patterns in salivary glands and imaginal discs.
Transcriptional profile of eyg and toe during the third larval instar. Probes are listed at the top of each column. Tissue type is denoted at the right of each row. Note that the expression patterns are nearly identical. Arrow in panel I marks area of the wing disc in which ectopic eye development is supported by the expression of several retinal determination genes including ey.

