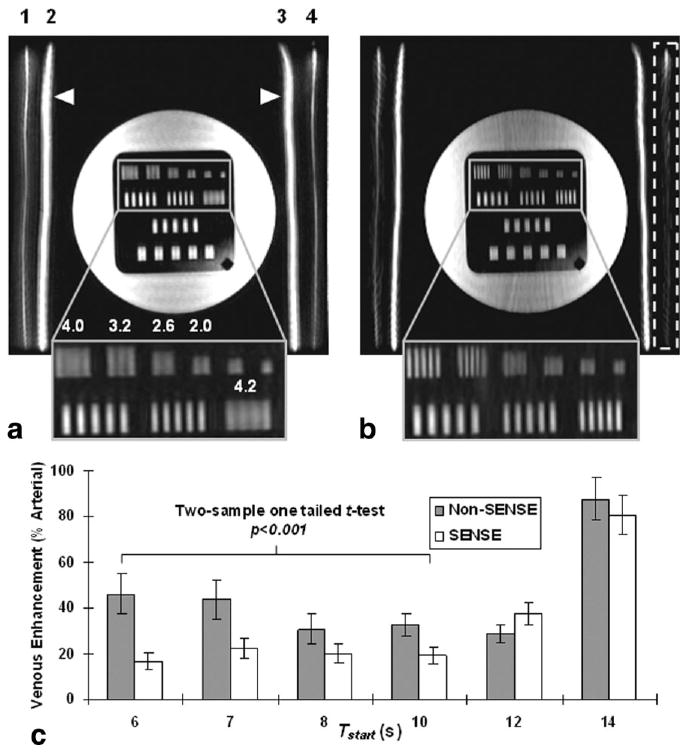
FIG. 3.

MIP images from the flow phantom experiment using EC view order (a) without SENSE and (b) with SENSE for Tstart = 10 s. Note the improvement in resolution bars (enlarged inset). The distance per line pair for each set of better-resolved bars is indicated in millimeters. Numbers above the vessels in image a correspond to those in Fig. 2. Note the significant venous suppression with SENSE for vessel 4 (dashed box) in b. c: Bar graph illustrating venous enhancement (% arterial signal) versus Tstart for non-SENSE and SENSE acquisitions. SENSE significantly suppressed venous signal (P < 0.001) for Tstart values < 10 s (Tstart = 6–10 s). For Tstart = 12–14 s, venous overlay was not suppressed by SENSE, principally because the EC acquisition was initiated during onset of the venous phase.
