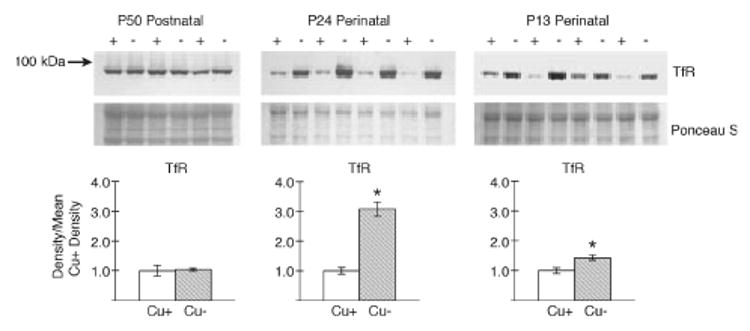
Fig. 4.

Rat brain expression of transferrin receptor 1 (TfR). SDS– PAGE 10% and western immunoblot analyses of brain membrane extracts from male Cu-adequate (+) (Cu+) and Cu-deficient (−) (Cu−) rats following postnatal (P50) or perinatal (P24 and P13) dietary Cu deficiency were conducted using mouse anti-human TfR antibody. A molecular weight (kDa) marker is shown on the left. Membranes were stained with Ponceau S to illustrate equal loading of protein. Lanes in the P50 membrane contained 15 μg protein, in the P24 membrane 12 μg protein, and in the P13 membrane 15 μg protein. Densities of the TfR bands were determined and compared with the mean values of Cu+ rats. Bars are means ± SEM. Mean Cu-/Cu+ TfR value for P50 was 1.04 and unchanged, whereas for P24 the ratio was 3.08 and for P13, 1.45, * p < 0.05.
