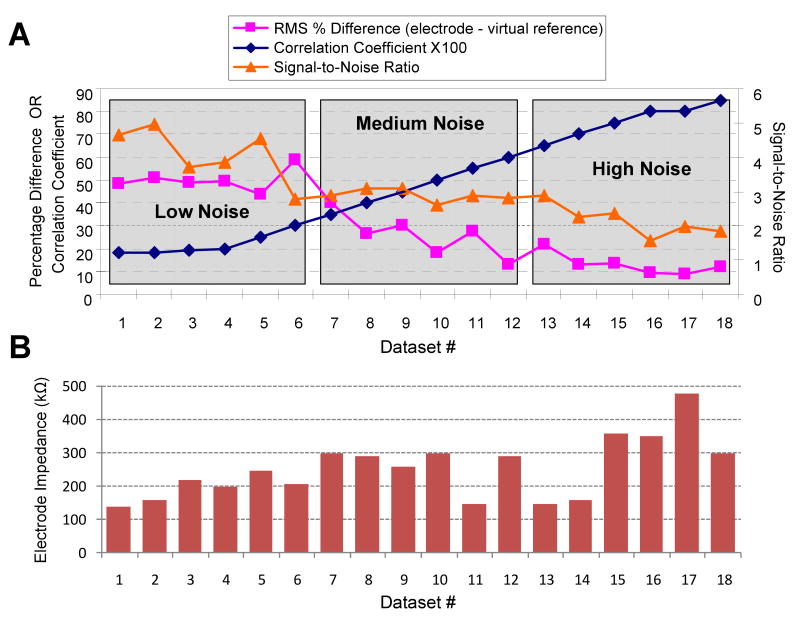
Figure 2. Objective Data Selection.
(A) Data sets were selected so that algorithm performance could be evaluated for a range of common-noise content. Data sets were composed of 5-minute recordings from unanesthetized animals that received 8-channel implants. They are ranked in order of observed common-noise content (1 is lowest, 18 is highest) as determined by the average correlation coefficient among all electrode signals over the 5-minute session. The difference in the RMS energy between the virtual reference (created by averaging all signals in the array) and the analyzed electrode signals showed an opposite trend. Taken together this means that datasets with high correlation also had similar RMS energy levels across the array. Signal-to-noise ratio as defined in the Methods is also presented to illustrate the quality of recordings used in this study. (B) Electrode impedance magnitude (at 1kHz) of the test electrode measured the same day the neural recordings for the given dataset were obtained.

