
Fig. 3. Co-localization of Asb-4 with GPS1 and distribution of Asb-4 in neurons.
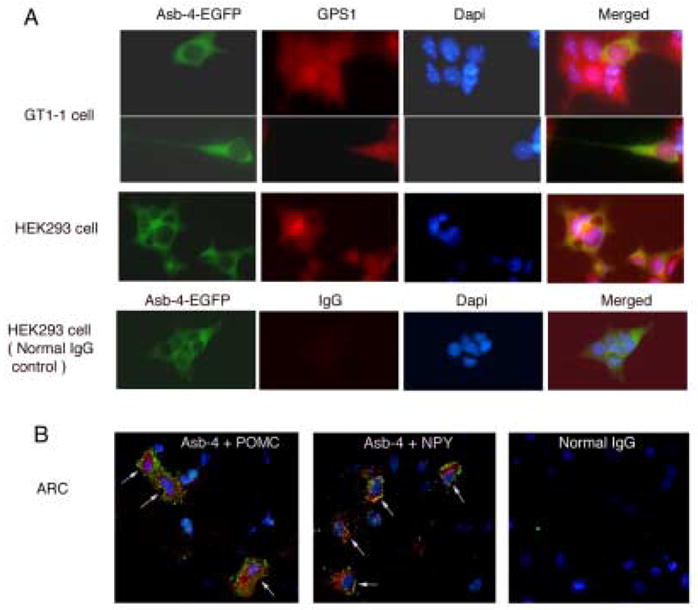
A. Green represents Asb-4-EGFP fusion protein and red represents GPS1. Yellow, merged images represent co-localization of Asb-4-EGFP with GPS1. B. Confocal photomicrographs of dual stainings of Asb-4 (green ) and POMC or NPY (Red). Normal IgG was used in negative control. Nuclei are stained with DAPI.