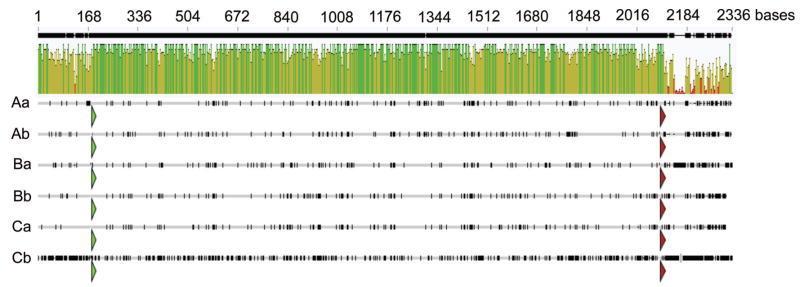
Fig. 3.
Sequence comparison of AaHsp70 genes. Complete transcripts for six AaHsp70 genes were aligned using ClustalW (Geneious, Biomatters, Aukland, New Zealand) to produce an identity graph. The start of each open reading frame is marked with a green arrow, and the end with a red arrow. Dark marks on lines representing each AaHsp70 gene indicate base changes from the consensus AaHsp70 sequence.

