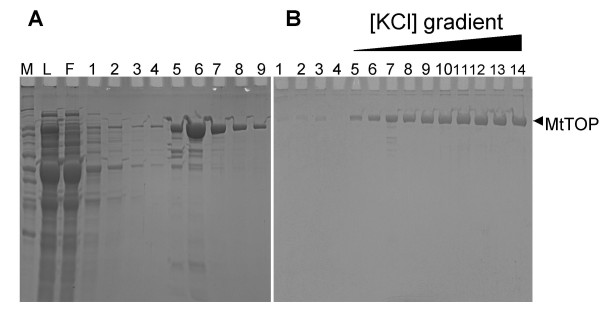
Figure 2.
SDS PAGE at different stages of MtTOP purification. A. Wash (lanes 1–4) and elution (lanes 5–9) fractions of fusion protein passed through a Ni-NTA agarose column. Lanes M represents molecular marker and lanes L and F represent the initial load and flow through of the Ni-NTA agarose column before wash and elution. B. Wash fractions (lanes 1–4) and potassium chloride gradient elution fractions (lanes 5–14) of TEV digested fusion protein loaded onto single-strand DNA cellulose column.

