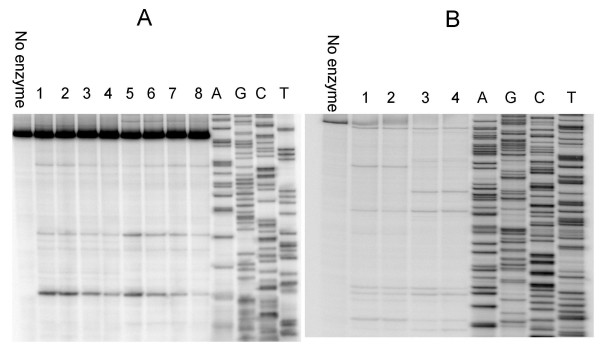
Figure 6.
Mapping cleavage sites on single-stranded DNA substrate. A. Single-stranded DNA substrate Mtop (216 bases) amplified from topA gene of M. tuberculosis was utilized to map cleavage sites of EcTOP and MtTOP. Lanes 1–4: cleavage reactions containing 400, 300, 200, 100 ng of EcTOP respectively. Similarly lanes 5–8 contain 400, 300, 200, 100 ng of MtTOP respectively. B. Single-stranded DNA substrate PBAD (556 bases) amplified from pBAD/thio plasmid was utilized to map cleavage sites of EcTOP and MtTOP. Lanes 1–2: cleavage reactions containing 400, 300 ng of EcTOP respectively. Similarly lanes 3–4 contain 400, 300 ng of MtTOP respectively. Lanes A, G, C, T containing the sequencing reactions with the corresponding nucleotide termination mixes were electrophoresed along with EcTOP and MtTOP cleavage reactions to determine the cleavage sites.

