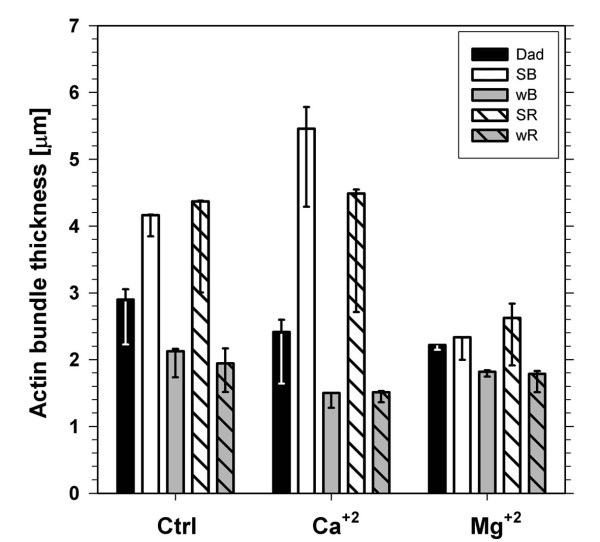
Figure 3.
Thickness of actin bundles in control (Ctrl) and in the presence of calcium (Ca+2) and magnesium (Mg+2) ions. The bundle thickness was measured in cells adapted to darkness (Dad, black bars) and in cells illuminated with strong (SB) or weak (wB) blue light (empty and gray bars, respectively) and with strong (SR) or weak (wR) red light (backslashed and backslashed gray bars, respectively). The thickness was calculated in micrometers (μm) as 99th percentile of the data corresponding to averages of optical sections, whereas error bars represent 95% confidence intervals.

