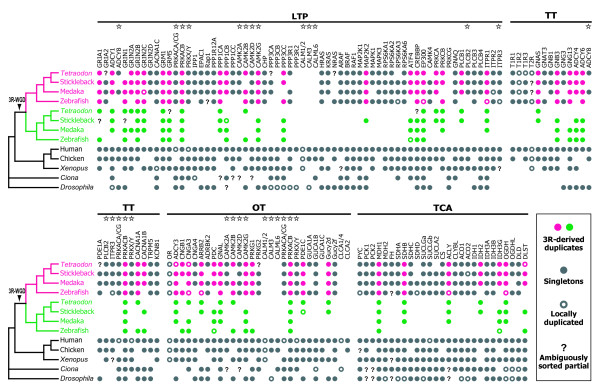
Figure 2.
Schematic representation of the results of comparative genomics-based data mining and maximum likelihood phylogenetic inferences for each gene. The magenta and green circles denote the presence of genes belonging to the orthologous gene groups in which 3R-WGD-derived duplicates were detected. Gray circles indicate the presence of singleton genes. Open circles denote loci that were specifically duplicated within the species. Question marks indicate the presence of partial gene sequences that are phylogenetically unsorted. Stars denote those gene groups involved in more than one network. Abbreviations: LPT, long-term potentiation; TT, taste transduction; OT, olfactory transduction; TCA, tricarboxylic acid cycle; 3R-WGD, third-round whole genome duplication.

