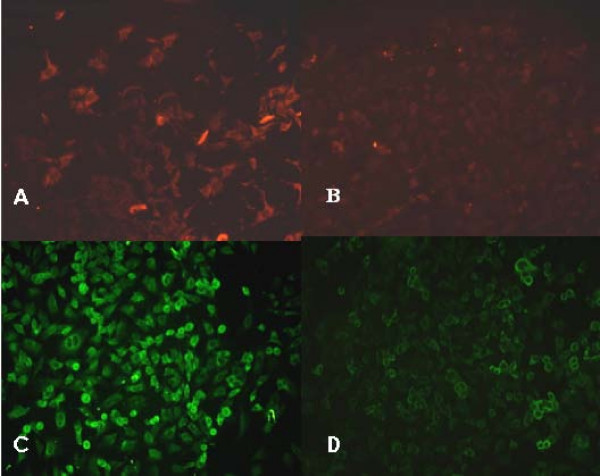
Figure 6.
Effect of staurosporine on the level of MMP-9 and uPA in A549 cells using fluorescence microscopy (× 200). A: Control (untreated) A549 cells. The background signal of MMP-9 is relatively high. B: A549 cells treated with 100 nM staurosporine for 24 h. The signal due to MMP-9 decreased. C: Control (untreated) A549 cells. The background signal of uPA is relatively high. D: A549 cells treated with 100 nM staurosporine for 24 h. The signal due to uPA decreased.

