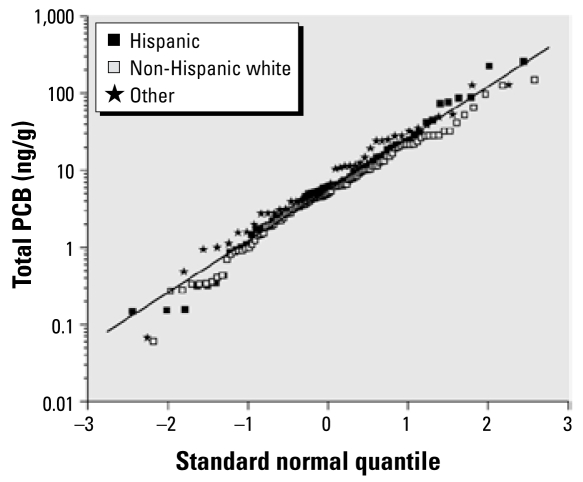
Figure 1.
Quantile–quantile plot of summed PCB concentrations for Hispanic, non-Hispanic (NH) white, and other racial groups. The fitted line, which is based on all measurement data, represents log-normally distributed data with geometric mean of 5.63 ng/g, geometric SD of 4.65 ng/g, and arithmetic mean of 16.23 ng/g.

