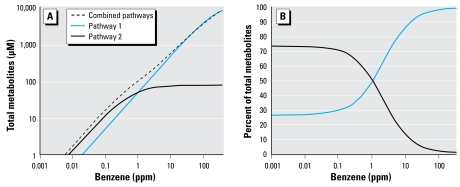
Figure 3.
Predicted contributions of two metabolic pathways toward production of total metabolites at different levels of benzene exposure. (A) Predicted mean trend (metabolic pathway 1 + metabolic pathway 2) and partial trends (metabolic pathway 1 or metabolic pathway 2) representing background-adjusted levels of benzene metabolites for a typical nonsmoking female subject. Predictions were based on parameters estimated for the two-pathway model (Equation 2) from the original regression (see Table 2). (B) Predicted percentages of benzene metabolites from the trends shown in (A) for the individual metabolic pathways.

