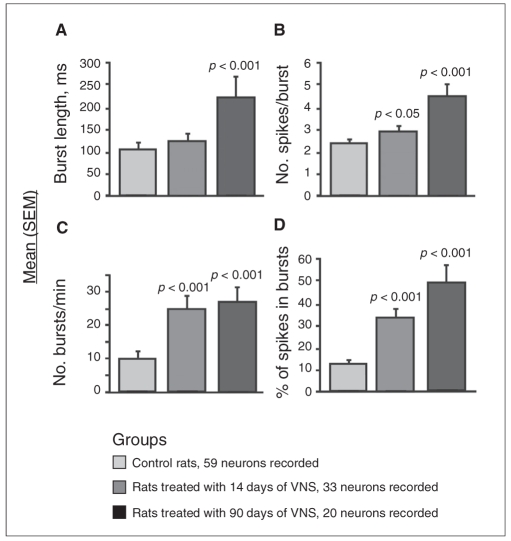
Fig. 1.
Histograms representing mean (and standard errors of the mean [SEM]) (A) burst length, (B) spikes per burst, (C) number of bursts per minute and (D) percentage of spikes in bursts of locus coeruleus norepinephrine neurons in control rats and in rats treated with 14 or 90 days of vagus nerve stimulation (VNS). We used 5–9 rats per group. We determined significance using the linear mixed model.

