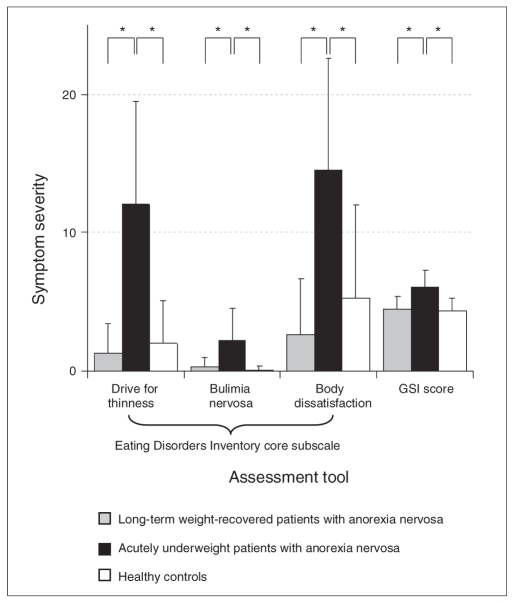
Fig. 1.
Mean scores and standard deviations on the Eating Disorders Inventory-238 core subscales and the Symptom Checklist-90-Revised39 Global Severity Index (T score × 10−1) for long-term weight-recovered patients with anorexia nervosa (recAN group), acutely underweight patients with anorexia nervosa (acAN group) and controls. Significant differences on Tamhane post-hoc tests for multiple comparisons between the acAN and control groups and between the acAN and recAN groups are indicated by asterisks (p < 0.001). There were no statistically significant differences between the recAN and control groups (p = 0.65 for drive for thinness, p = 0.45 for bulimia nervosa, p = 0.23 for body dissatisfaction and p = 0.98 for Global Severity Index).

