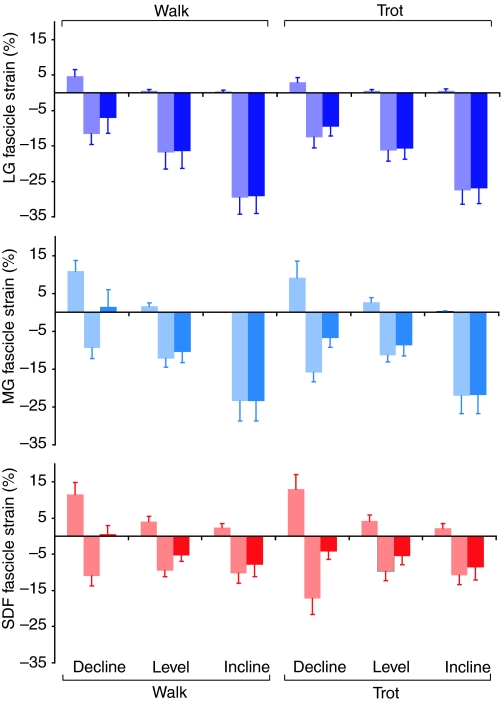
Fig. 4.
Muscle fascicle strains (lengthening, shortening and net %) recorded via sonomicrometry for the LG, MG and SDF muscles for decline, level and incline conditions averaged across both walking (1.0 and 1.5 ms–1) and trotting (2.5 ms–1) conditions (values shown are means ± s.e.m.). Positive strains represent fascicle lengthening and negative strains fascicle shortening. Net strain is shown as the darker bars.

