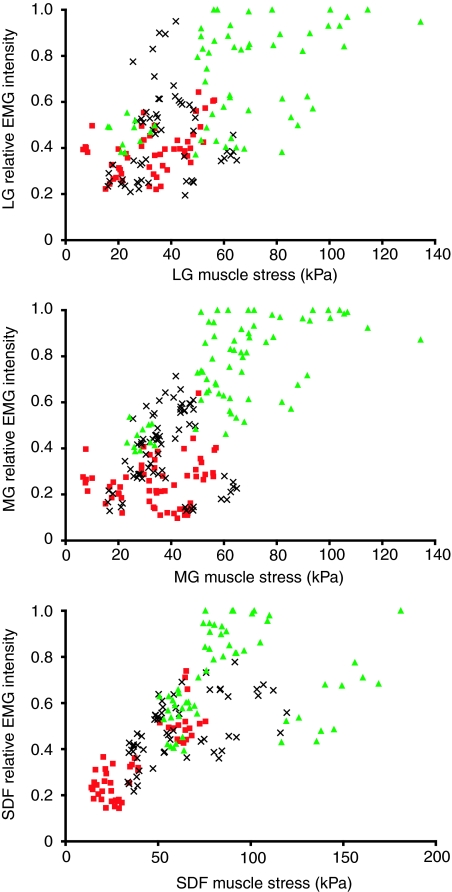
Fig. 7.
Relative EMG intensity (mean spike amplitude normalized to the maximum value obtained during incline trotting) of the LG, MG and SDF plotted against muscle stress (kPa) for the two gaits and three grade conditions. Decline strides are represented by red squares, level strides by black crosses and incline strides by green triangles. Muscle stress in the MG and LG was derived from their shared tendon force and was therefore assumed to be the same for the two muscle heads (see Materials and methods). A significant correlation between muscle stress and EMG activation intensity was observed in all muscles when compared across the gaits and grades (Table 2).

