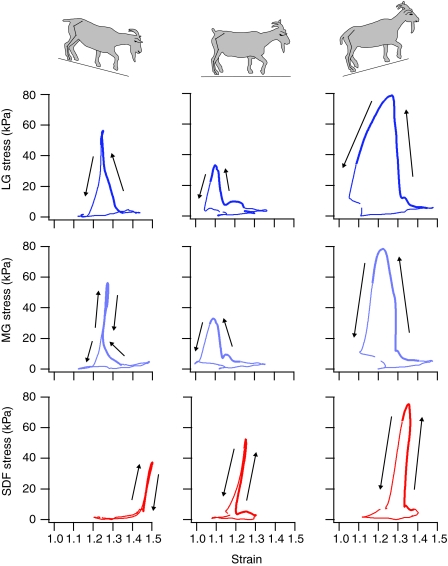
Fig. 8.
Representative muscle work loops (shown as in vivo muscle stress plotted versus fascicle strain) of the LG, MG and SDF for a single stride cycle during decline, level and incline trotting (2.5 ms–1). Thicker portions of the line in each work loop denote the period of muscle activation. Arrows denote the direction of changes in muscle stress versus fascicle strain (strain=1.0 denotes the resting length of the fascicles recorded during quiet stance). Net work per cycle is denoted by the area within the work loop (here normalized as muscle stress and strain), with counter-clockwise loops denoting net positive work. In all three muscles, muscle stress (force) and net shortening strain increase as animals move from decline to level, to incline conditions.

