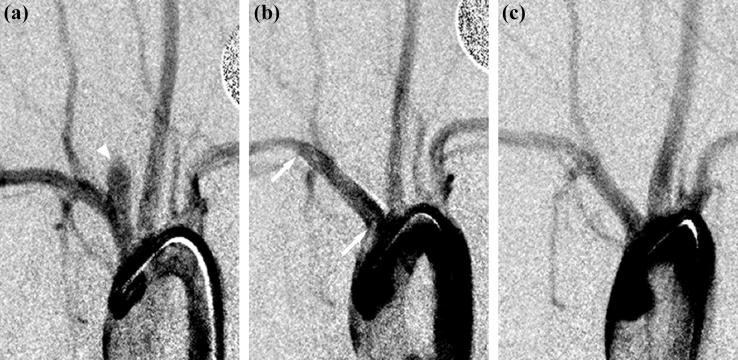
Fig. 3.
Angiograms of an aneurysm (a) before device implantation, arrowhead shows aneurysmal sac; (b) immediately after device implantation (device II), arrows indicate proximal and distal edges of the flow diverter; (c) at follow-up (180 days). Angiographically, the aneurysm is completely occluded.

