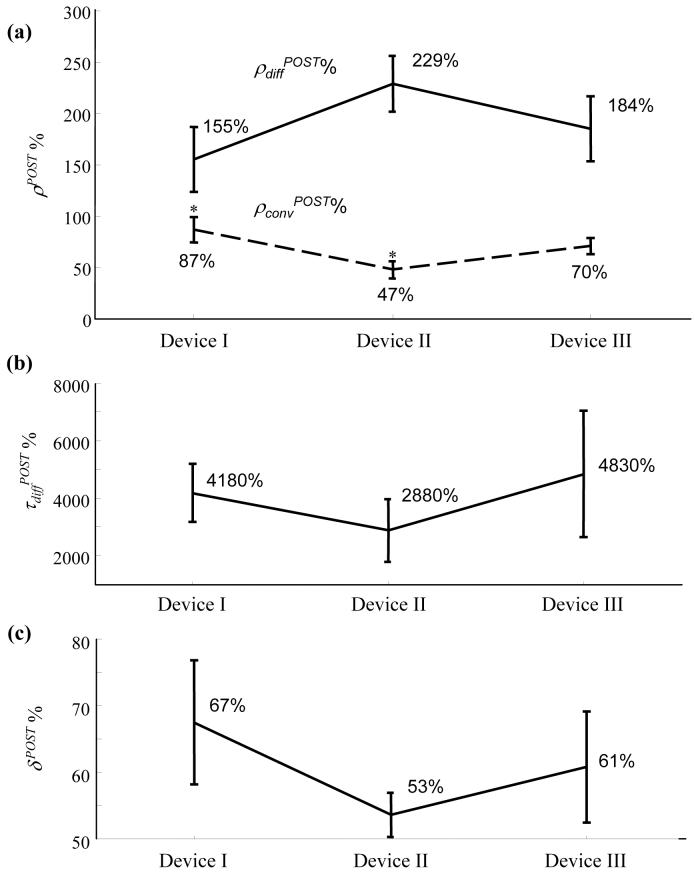
Fig. 7.
Indices of device efficacy obtained from the analysis of aneurysmal washout curves. (a) Mean (standard error) percentage ratios of amplitudes of the convective (ρconv, dashed line) and diffusive (ρdiff, solid line) components immediately after device implantation as a percentage of the corresponding values before device implantation. * The ρconvPOST% value for device II was significantly lower than that for device I (p = 0.016). (b) & (c) Corresponding mean (standard error) values for the diffusive time constant and washout curve amplitude, respectively. Number of samples; device I (n=9), device II (n=10), device III (n=8).

