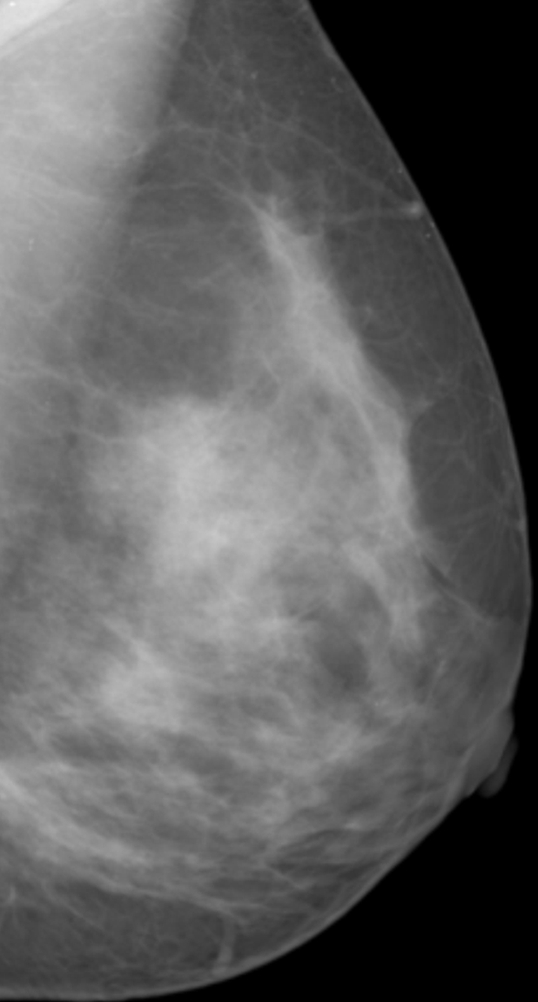
Figure 1a:

Estimation of PD on (a, b) digital mammograms and (c, d) central DBT projections in the same breast by using the Cumulus software. The original mediolateral oblique views (a, c) are windowed and leveled to enable optimal visualization of the dense tissue. The pectoral muscle is segmented manually, followed by interactive selection of the threshold values for segmentation of the background nonbreast area (dark gray) and the dense tissue (light gray). PD is computed as the ratio of the dense tissue area and the total breast area in b and d.
