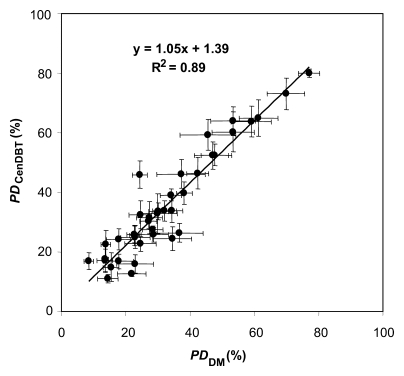
Figure 3b:
(a) Scatterplot of PD on digital mammograms (PDDM) and central DBT projections (PDCenDBT), as estimated by three readers (R1, R2, and R3) in two sessions (session 1 [s1] and session 2 [s2]) repeated 2 months apart. (b) Scatterplot of average PD on digital mammograms (PDDM) and central DBT projections (PDCenDBT), computed over all estimations for each analyzed breast. Error bars = ±1 standard error of mean.

