
Figure 3.
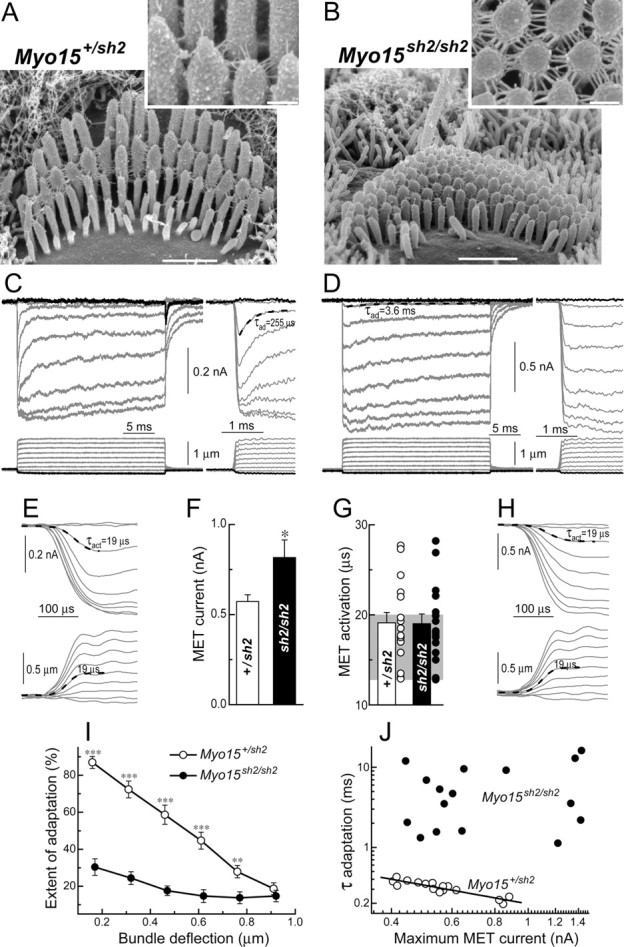
Loss of fast adaptation in Myo15 sh2/sh2 IHCs. A, B, SEM images of Myo15 +/sh2 (A) and Myo15 sh2/sh2 (B) IHCs from approximately the same mid-cochlear location. Insets show stereocilia links of these cells at higher magnification (and different viewing angle in B). Scale bars: 1 μm (main panels); 200 nm (insets). C, D, MET responses (top traces) evoked by the graded deflections of stereocilia in the same specimens that were imaged in A and B. Horizontal movement of the piezo-driven probe was monitored by a photodiode technique (bottom traces). Responses to negative deflections are shown in black color. Right traces show the beginning of MET responses on a faster time scale to reveal fast adaptation. Adaptation at the small bundle deflection of 150 nm (τad) is fitted with single exponential decay (dashed lines). E, H, The same MET records on an ultrafast time scale to reveal time constants of MET activation and probe movement. Holding potential was −90 mV. Age of the cells: (A, C, E) P2 + 2 d in vitro; (B, D, H) P3 + 1 d in vitro. F, Average maximum MET responses. G, Time constants of MET activation (τact): average and row data. Gray area indicates the range of time constants of the stimuli in the same experiments. I, Percentage changes of the MET current at the end of 25 ms stimulation step (extent of adaptation) as a function of stimulus intensity. J, The relationship between maximum MET current and time constant of adaptation at the small bundle deflection of 150 nm. Solid line shows least squares fit to data points from Myo15 +/sh2 IHCs, r = −0.91, p < 0.0001. The same records contribute to F, G, I, and J. Number of cells: n = 17 (Myo15 +/sh2), n = 18 (Myo15 sh2/sh2). All averaged data are shown as mean ± SE. Asterisks indicate statistical significance: *p < 0.05, **p < 0.01, ***p < 0.0001 (t test of independent samples).