
Figure 5.
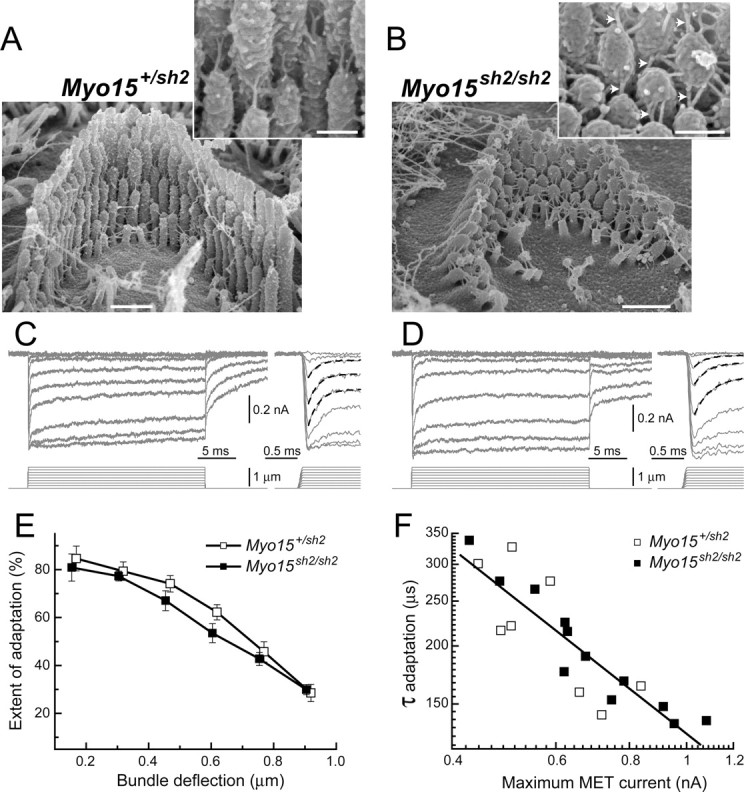
Apparently normal adaptation in Myo15 sh2/sh2 OHCs. A, B, SEM images of Myo15 +/sh2 (A) and Myo15 sh2/sh2 (B) OHCs from approximately the same mid-cochlear location. Insets show stereocilia links at higher magnification. Presumable tip links in Myo15 sh2/sh2 OHCs are indicated by arrowheads. Scale bars: 0.5 μm (main panels) and 200 nm (insets). C, D, MET responses (top traces) evoked by the graded deflections of stereocilia in the same specimens that were imaged in A and B. Movement of the piezo-driven probe was calibrated by video recording and command voltage was converted to displacement units. Right traces show the beginning of MET responses on a faster time scale. Fast adaptation to small stimuli is fitted with single exponential decays (dashed lines). Holding potential was −85 mV. Age of the cells: (A, C) P2 + 1 d in vitro; (B, D) P2 + 2 d in vitro. E, Percentage changes of the MET current at the end of 25 ms stimulation step (extent of adaptation) as a function of stimulus intensity. Data are shown as mean ± SE F, The relationship between maximum MET current and the time constant of fast adaptation to small bundle deflection of 150 nm. Solid line shows least squares fit to all points, r = −0.88, p < 0.0001. The same records contribute to E and F. Number of cells: n = 8 (Myo15 +/sh2), n = 12 (Myo15 sh2/sh2).