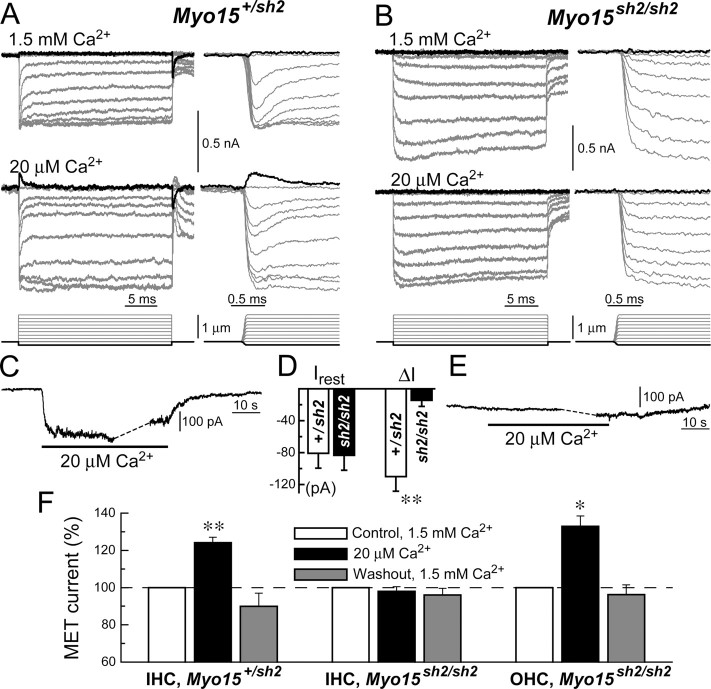
Figure 6.
Disrupted Ca2+ sensitivity of the MET machinery in Myo15 sh2/sh2 IHCs. A, B, MET responses in Myo15 +/sh2 (A) and Myo15 sh2/sh2 (B) IHCs evoked by the graded deflections of stereocilia in an extracellular solution containing 1.5 mm Ca2+ (top traces) and in low Ca2+ solution containing 20 μm Ca2+ (middle traces). Bottom traces show command voltage converted to displacement units. Right panels show the same records on a faster time scale. Scale bars of the MET current apply to both top and middle traces. C, E, Changes of the whole-cell current produced by low extracellular Ca2+ in the same IHCs. Dashed lines indicate the breaks, during which we examined MET responses in low Ca2+ environment. Age of the cells: (A, C) P3 + 5 d in vitro; (B, E) P3 + 4 d in vitro. D, Resting whole-cell current at holding potential of −60 mV (I rest) and the changes of this current (ΔI) evoked by the application of low Ca2+ extracellular medium to the stereocilia bundles of Myo15 +/sh2 (open bars) and Myo15 sh2/sh2 (closed bars) IHCs. F, Maximum amplitude of MET responses during and after application of low Ca2+ extracellular solution as a percentage of maximal amplitude of MET responses before application. MET responses were recorded at holding potential of −90 mV. Averaged data in D and F are shown as mean ± SE. Number of cells: n = 6 (IHCs, Myo15 +/sh2), n = 8 (IHCs, Myo15 sh2/sh2), n = 3 (OHCs, Myo15 sh2/sh2). Asterisks indicate statistical significance: *p < 0.05, **p < 0.01 (t test of independent samples in D and paired t test in F).

