
Figure 3.
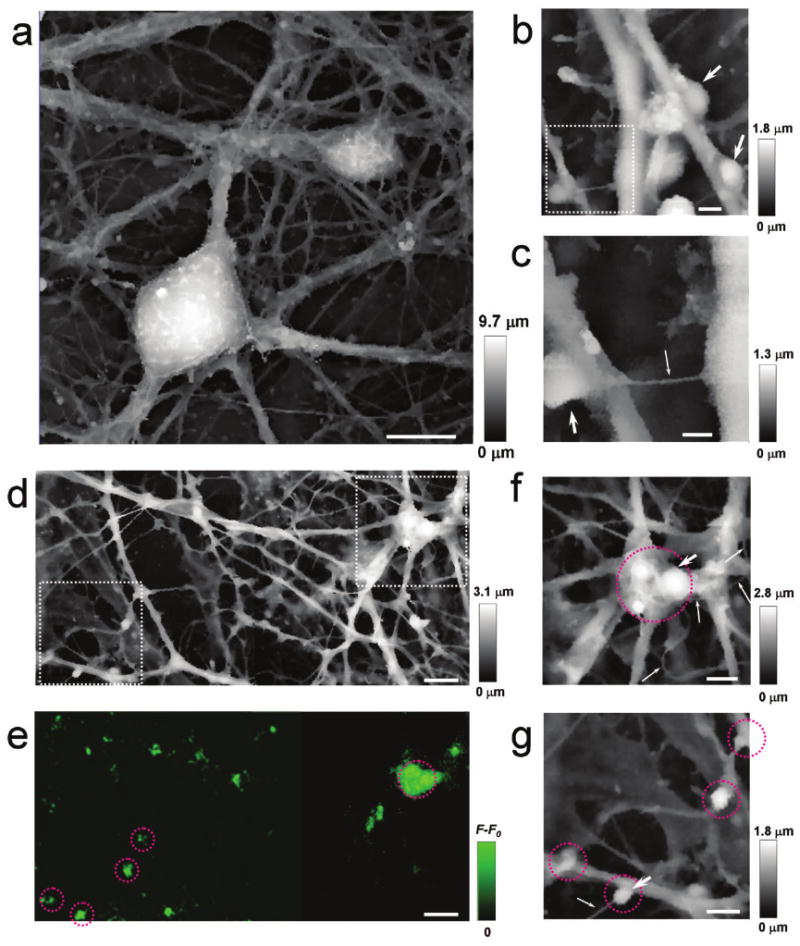
HPICM images of live hippocampal neurons. (a) An image of a large area of the neural network. (b) Potential synaptic boutons (arrows). (c) A higher resolution image of the dotted region in (b) with another possible bouton. The process with a diameter of 50 nm, marked by a fine arrow in c, is likely to be an axon. HPICM (d) and fluorescence (e) images of the same neuronal network area that has been stained with a live marker of synaptic activity, FM1-43. (f) A high resolution image of the dotted area in the top right corner of (d). Potential synaptic boutons are circled in red or marked with a large arrow. Fine processes, probably axons, are marked by thin arrows. (g) A high resolution image of the dotted area in the bottom left-hand corner of (d). Scale bars: a 10 μm; b 1 μm; c 500 nm.; d & e 5 μm; f & g 2 μm.