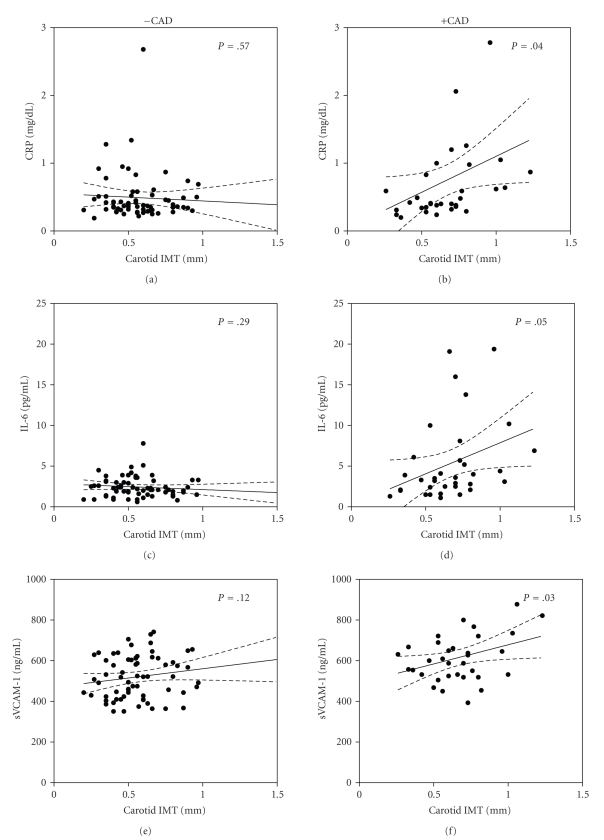
Figure 3.
Scatter plots showing the correlation of intima-media thickness (IMT), and plasma levels of C-reactive protein (CRP; (a), (b)), interleukin 6 (IL-6; (c), (d)) and vascular adhesion molecule 1 (sVCAM-1; (e), (f)) in dyslipidemic subjects with (+CAD, n = 33) or without (−CAD, n = 69) symptomatic coronary artery disease. Solid lines represent the best-fit values for the linear regression, dashed lines represent the 95% confidence interval for linear regression, and P-values represent the probability for the slope of each regression being different to 0.

