
Figure 9.
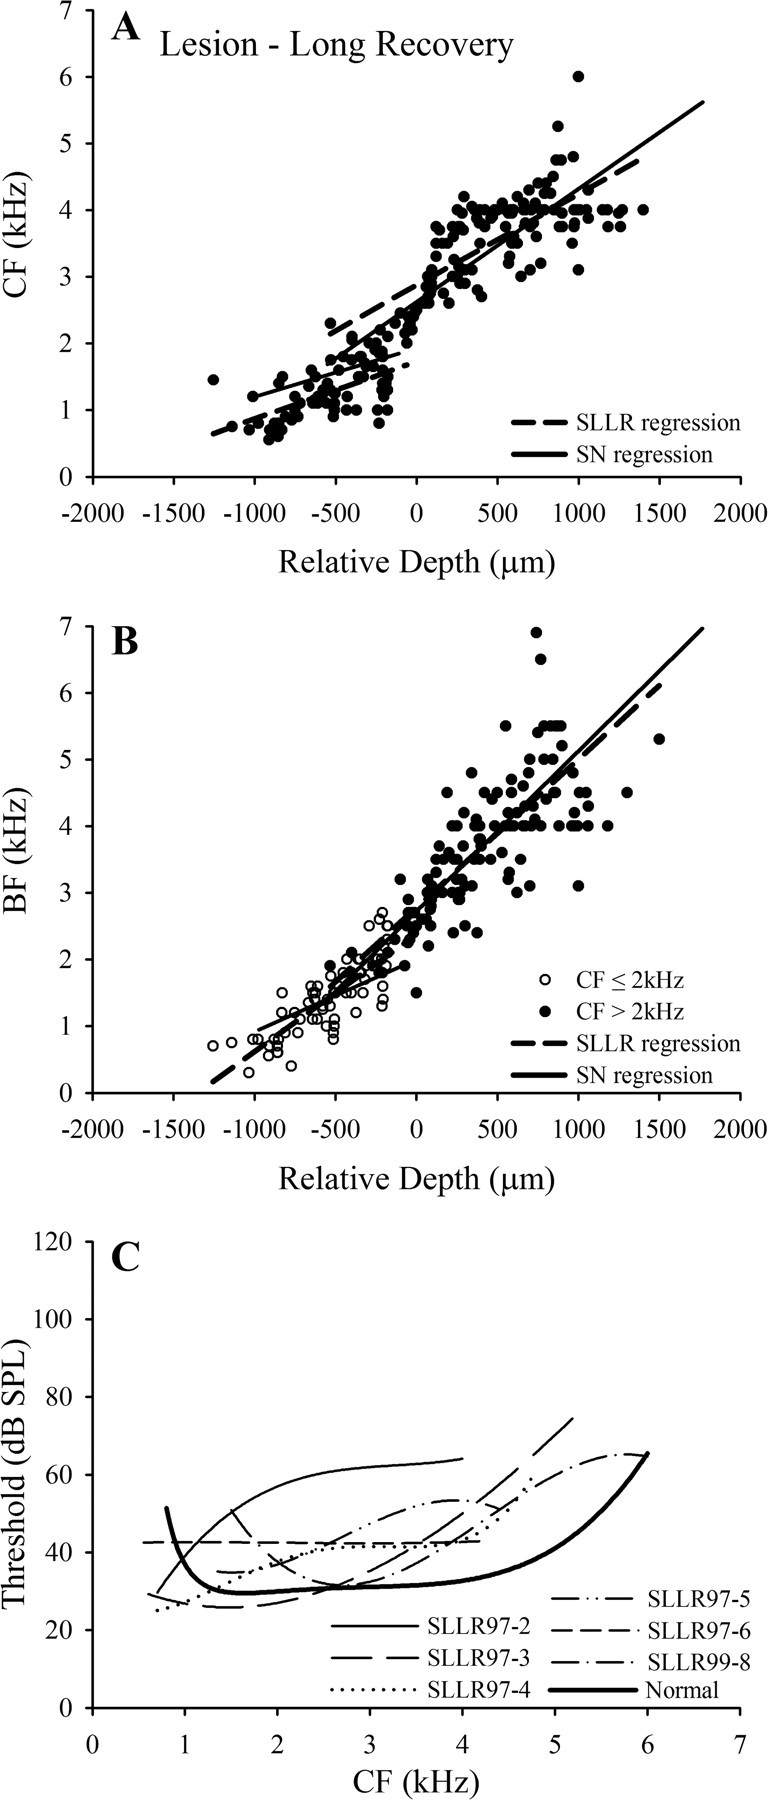
Group frequency mapping data for lesion–long recovery (SLLR) starlings. A, B, Pooled CF and BF data, respectively, for the six lesion–long recovery starlings; broken lines are regression functions for the SLLR data; solid lines are functions for the SN group (from Fig. 2) [r 2 values: CF ≤2 kHz, 0.38; CF >2 kHz, 0.57; BF (for CF ≤2 kHz), 0.70; BF (for CF >2 kHz), 0.57]. C, Individual polynomial functions fitted to CF threshold data for the six SLLR starlings (see key), plotted with mean normal threshold function (Fig. 2 C, heavy black line).