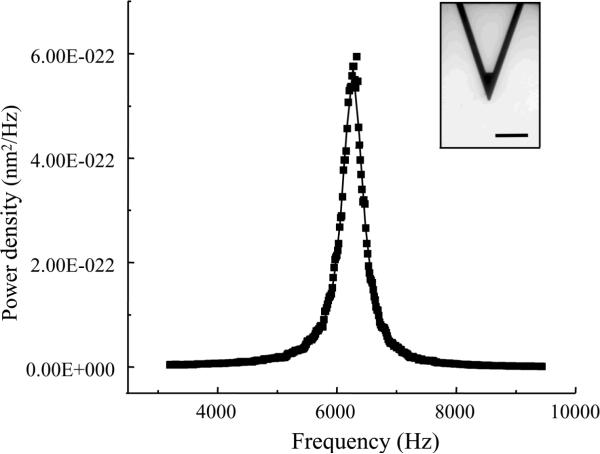
Figure 2.
A typical power density spectrum of a cantilever. A bright field image of a triangular (320 μm long) silicon nitride cantilever is shown in inset. Integration of power density over frequency gives the average square amplitude <x2> which can be used to calculate the spring constant k. Scale bar in inset, 100 μm.

