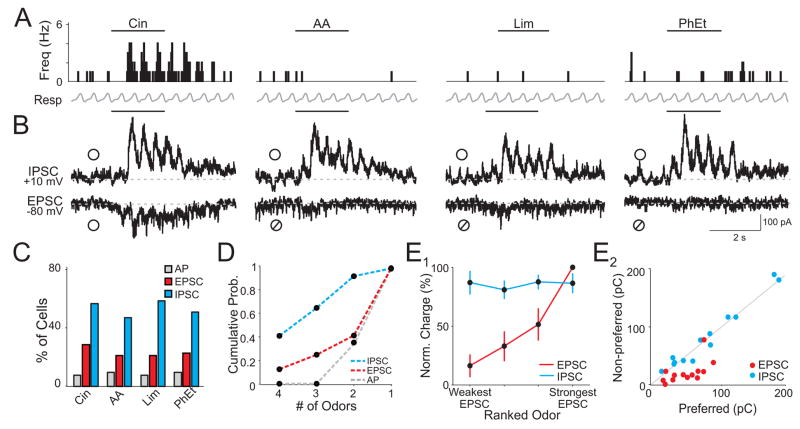
Figure 2. Odors evoke widespread and nonselective inhibition.
(A) Peristimulus time histogram of APs recorded in cell-attached mode from a single cell. Bars indicate odor delivery. (B) Subsequent voltage clamp recording of excitation (EPSC) and inhibition (IPSC) from the same cell in (A). ○, odor response, ⌀, lack of response. Traces are averages of 5 trials. (C) Population responses to four odors (n=52 cells). (D) Cumulative probability distribution of odor selectivity for each cell. (E1) Normalized and ranked odor-evoked EPSC charge for cells with odor-evoked APs. IPSC charge (normalized to the strongest inhibitory response in each cell) is plotted for each of the corresponding odors ranked by EPSC strength (n =13 cells). (E2) EPSC and IPSC charge for odors that evoked spikes (Preferred) versus odors that did not generate spikes (Non-Preferred) in the same cells (n = 13 cells). Odors: cineole (Cin), amyl acetate (AA), R-limonene (Lim), phenyl ethylalcohol (PhEt).

