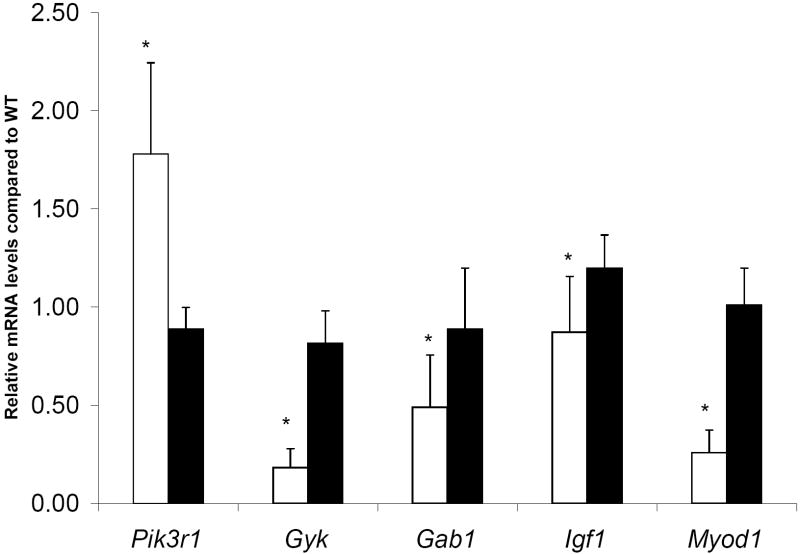
Figure 3.
qPCR data (mean ± SEM) expressed as relative mRNA levels of Gyk KO compared to WT mice. Phosphatidylinositol 3-kinase, regulatory subunit, polypeptide 1 (Pik3r1), glycerol kinase (Gyk), growth factor receptor bound protein 2-associated protein 1 (Gab1), insulin-like growth factor 1 (Igf1), myogenic differentiation factor 1 (Myod1) *p< 0.05, student t test. White bars represent Gyk KO mice and black bars represent WT mice.

