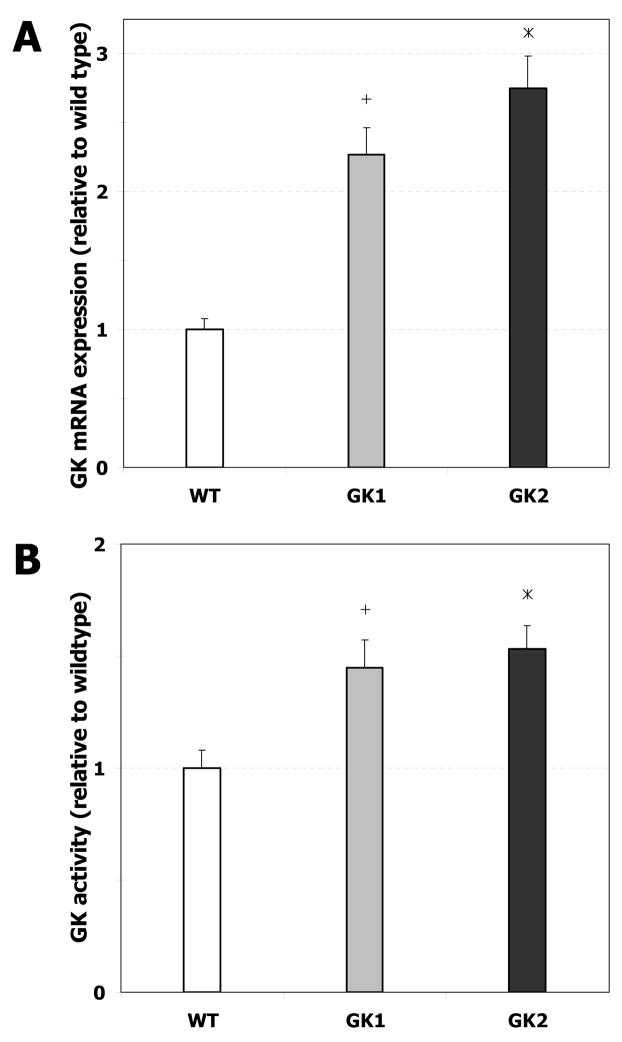
Fig. 1. GK expression and enzymatic activity in wild type (WT) and GK-overexpressing (GK1 and GK2) H4IIE cell lines.
A. GK mRNA expression, quantified as described in Materials and Methods, is reported relative to wild type. Error bars represent standard deviation between biological replicates. ‘+’ denotes significant difference (p < 0.05) between GK1 and the wild type, ‘*’ denotes significant difference (p < 0.05) between GK2 and the wild type. B. GK enzymatic activity, determined as described in Materials and Methods, is reported relative to wild type. Error bars represent standard deviation between biological replicates. ‘+’ denotes significant difference (p < 0.05) between GK1 and the wild type, ‘*’ denotes significant difference (p < 0.05) between GK2 and the wild type.

