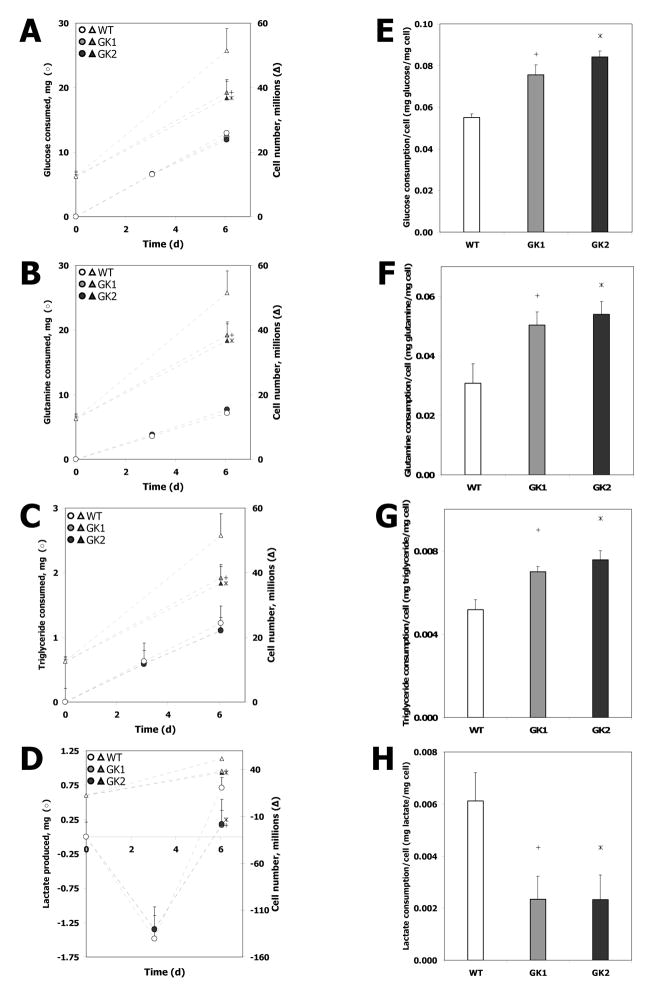
Fig. 2. Carbon source consumption in wild type (WT) and GK-overexpressing (GK1 and GK2) H4IIE cell lines.
(A) Glucose consumption, (B) glutamine consumption, (C) triglyceride consumption, and (D) lactate production by the wild type and cell lines GK1, and GK2 (circles, left axis). The corresponding increase in cell number (triangles, right axis) is shown on all three plots for reference. The consumption/production on a per cell basis is also shown: (E) glucose, (F) glutamine, (G) triglycerides, and (H) lactate. The numbers in panels E–H were obtained from panels A–D by dividing the carbon source consumption per day by the increase in cells (converted to mg) per day. Hollow circles, triangles, and bars: WT, gray circles, triangles, and bars: GK1, black circles, triangles, and bars: GK2. Error bars represent standard deviation between biological replicates. ‘+’ denotes significant difference (p < 0.05) between GK1 and the wild type, ‘*’ denotes significant difference (p < 0.05) between GK2 and the wild type.

