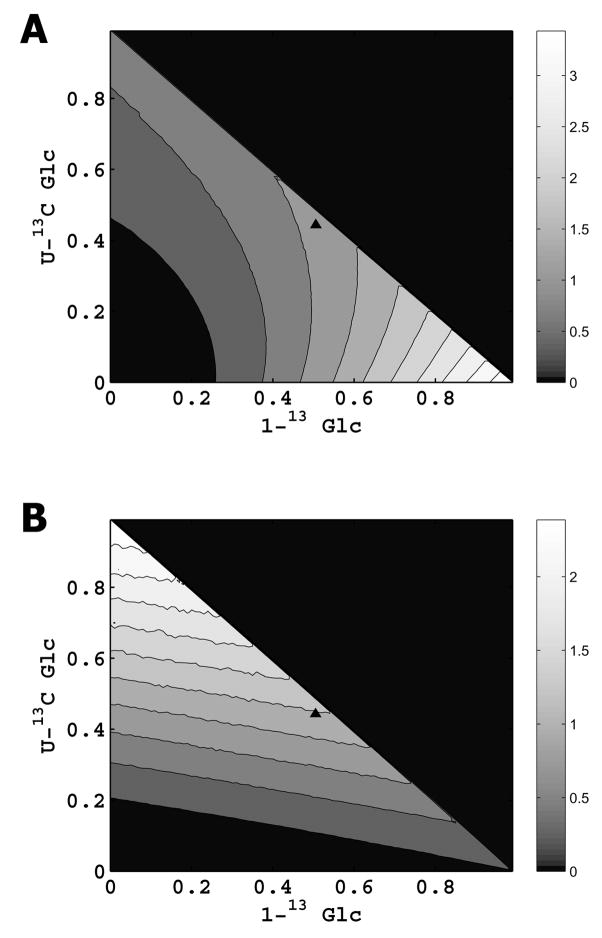
Fig. 3. Mathematical design of 13C labeling experiment.
A. Precision of 13C labeling experiment in determining glycolysis and PPP fluxes, when a mixture of 1-13C glucose, U-13C glucose, and naturally abundant glucose is supplied. Dark color indicates low precision, and light color indicates high precision, as shown in the adjoining color map. The 1-13C/U-13C glucose combination used in this work is indicated by ‘▲’. B. Precision of 13C labeling experiment in determining TCA cycle, anaplerotic, and associated carbon source entry fluxes, when a mixture of 1-13C glucose, U-13C glucose, and naturally abundant glucose is supplied. Dark color indicates low precision, and light color indicates high precision, as shown in the adjoining color map. The 1-13C/U-13C glucose combination used in this work is indicated by ‘▲’.

