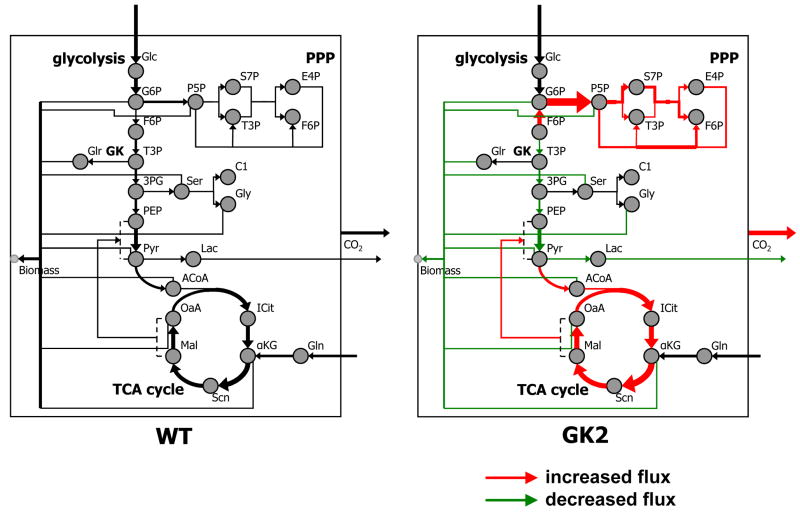
Fig. 7. Metabolic flux maps of wild type (WT) and GK-overexpressing cell line GK2, grown on a mixture of U-13C glucose, 1-13C glucose, and naturally abundant glucose.
Line widths are directly proportional to fluxes. Black lines denote intracellular fluxes, and gray lines denote anabolic fluxes contributing to biomass formation. Intracellular metabolites are shown as gray circles. The F6P and T3P pools appear twice (once each in glycolysis and PPP) to avoid excessive intersections of lines. The canonical pathways glycolysis, PPP, and TCA cycle are shown in italics, and the reaction sequence in which GK participates is shown in bold. Some reactions in the pathways are lumped; however the lumping retained the net carbon skeleton rearrangements of the reactions, and therefore did not affect the results. Since individual anaplerotic fluxes were not distinguishable, only the net anaplerotic flux (OaA/Mal → PEP/Pyr) is shown. Triglyceride intake flux, glycerol exchange flux, and acetyl CoA intake/lipogenesis are not shown for clarity. A list of all evaluated net fluxes is available in Fig. 8. Abbreviations: GK, glycerol kinase; PPP, pentose phosphate pathway; TCA, tricarboxylic acid; Glc, glucose; G6P, glucose-6-phosphate; F6P, fructose-6-phosphate; T3P, triose-3-phosphate; P5P, pentose-5-phosphate; S7P, sedoheptulose-7-phosphate; E4P, erythrose-4-phosphate; 3PG, 3-phosphoglycerate; Glr: glycerol; Ser, serine; Gly, glycine; C1: 1-carbon units participating in C-1 metabolism; PEP, phosphoenolpyruvate; Pyr, pyruvate; Lac, lactate; ACoA, acetyl CoA; ICit, isocitrate; αKG, α-ketoglutarate; Gln, glutamine; Scn, succinate; Mal, malate; OaA, oxaloacetate.

