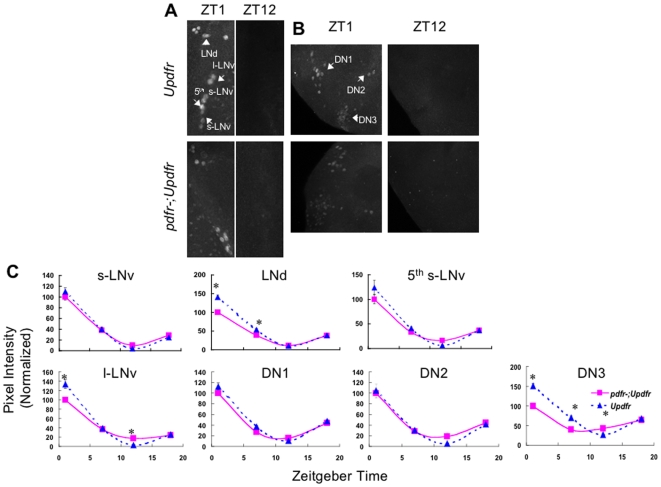
Figure 3. PERIOD cycles robustly in Pdfr mutants during LD.
(A,B) Maximum projections of confocal sections taken in representative adult UAS-Pdfr and Pdfrhan5304;UAS-Pdfr brains labeled with PER antibody. Sections contain either the lateral neurons (A) or the dorsal neurons (B) at ZT1 and ZT12, which are times of peak and trough PER expression. LN and DN subgroups are indicated by arrows. (C) Plots of average normalized pixel intensity versus Zeitgeber time for each pacemaker cell group for UAS-Pdfr/+ (dashed blue line) and Pdfrhan5304; UAS-Pdfr/+ (solid pink line). See Materials and Methods for details of quantification method. Error bars represent standard error of mean. The results are a combination of two independent experiments: s-LNv, n = 32–54; LNd, n = 28–88; 5th s-LNv, n = 10–16; DN1, n = 50–198; DN2, n = 11–24; DN3, n = 73–316. Only ZT1 and ZT7 for the LNd and ZT1, 7, and 12 for DN3 are statistically different from controls (p<0.001).

