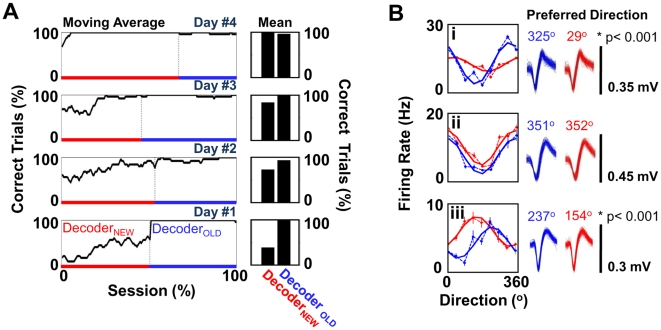
Figure 8. Simultaneous retention of two maps without interference.
(A) Changes in performance in the presence of two decoders over 4 d of training. DecoderNEW (red bar) was introduced on day 1. DecoderOLD (blue bar) represents the set of weights that were learned over the course of 19 d of training (as shown in Figures 2 and 3). The panels on the left show a moving average of the performance over the entire session (window size = 20 trials), and the panels on the right represent the mean session performance. (B) Changes in directional tuning for units during BC under DecoderNEW and DecoderOLD. Each inset (i–iii) shows the relationship (color convention as in [A]) for the firing rate versus direction (dotted line and filled circles, respectively). The error bars represent the s.e.m. The solid line represents the cosine fit for directional modulation of the firing rate. Shown on the right are 100 randomly selected waveforms for each unit under each of the two conditions. The numbers represent the preferred direction (PD). The asterisk (*) indicates p<0.005 for bootstrap analysis with correction of FDR for multiple comparisons.

